I have been meaning to write this piece on interpreting standardized test scores for quite some time. Now that IEP season is heating up, this is the perfect time. I always say that it all comes down to solid evaluations. Without them, you can’t identify your child’s strengths and weaknesses and therefore will not be able to develop proper goals. So often, parents are confused and overwhelmed by all the statistics in the evaluations. Mean, standard deviation, standard scores, percentiles . . . There are so many terms to know. It’s vital that parents have some understanding of how to read these reports, otherwise they will not be able to advocate for their children. But how detailed should I get? Statistics can get very complicated. In this installment, I will discuss some of the basics. Though it may seem intimidating, I promise it’s really not that bad. And if you take some time to understand the concepts discussed, you will feel much more confident at your next CSE meeting and will be stronger advocates for your children. And hey, it’s only March– Plenty of time to understand these concepts before annual review season! ;-)
It all starts with the dreaded Bell Curve. Maybe you remember this from school. Maybe you’ve intentionally forgotten! We’re going to use a simple speech and language (S&L) assessment as an example, but this applies to other standardized tests such as cognitive (e.g. IQ), OT, behavioral, and other assessments which define average or “mean” as being a “standard score” of 100. Remember, these are not tests taken in class where 100 is the highest grade. In those tests, the student is measured by how well she does on the test. With standardized tests, we measure how well the student does compared to other students her age or grade.
So we start with the average or mean S&L score of 100. That means that half of the kids who take the test will score above 100, and therefore be above average, and half will score below 100 and be below average. Of course, there’s an average range – a score of 95 is still considered average. Since we are usually more concerned about addressing a student’s weaknesses and obtaining supports and services to address them, we will be focusing more on below average scores. Though there are exceptions (to be left for a future article), if your child has a score of 100, she is exactly average and probably won’t be eligible for services in that area. But what if she scored a 90, or 80, or 70? At what score should you be concerned and push for services?
It starts with a “raw score” which is, quite simply, based on the number of questions a student gets correct on an assessment. If there are 100 questions on a test and our child gets 40 correct, then his raw score is 40. But remember, we need to compare this child to other children who took the same test; we need to standardize the scores. To do that, we must first convert the score to a standard score (don’t worry about how that’s done). So if half the kids who took the test got more than 40 correct and half got less than 40 correct, our child would be assigned a standard score of 100 – he’s exactly average!
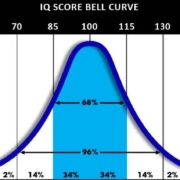
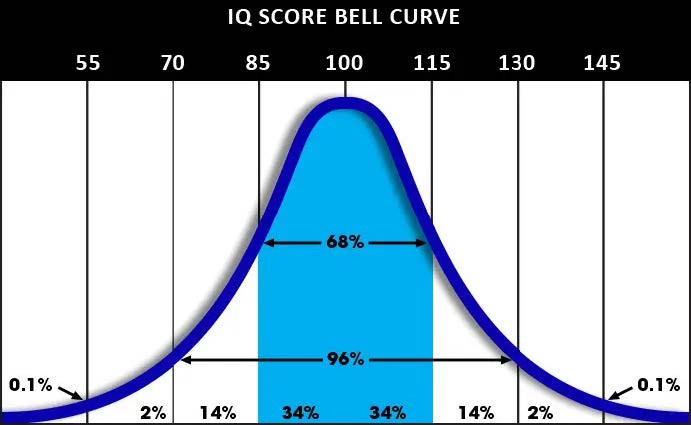
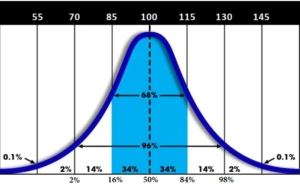
Our next term is “standard deviation” which measures how much scores vary (or deviate) from the average. I’m not going to get into too much detail with this concept. But for many of the assessments you’ll be looking at, one standard deviation will be equal to 15 points. Look at the Bell Curve below. Again, we’re just going to focus on the below average scores. You’ll see that 34% of all the test takers will have a standard score between 85 and 100; 100 being right in the middle and, therefore, the 50th percentile. Standard scores are more accurate, but we can convert them to percentiles. Percentiles indicate what percent of test takers earned higher scores than your child. Look at the Curve again. If your child earned a standard score of 85, one standard deviation from the mean, then you know she is in the 16th percentile, meaning that 84% of test takers performed better than her on the test. If she earned a standard score of 70, or two standard deviations from the mean, she would be in the 2nd percentile, meaning that 98% of her peers performed better than her. You can always ask the CSE to do the conversions, but it’s a good idea, for reference, to remember 100 as the 50th percentile and 85 as being the 16th percentile.
Below, I’ve included a handy Cheat Sheet that you can bring to your meetings for quick reference.
Speech & Language Evaluation (Standard Deviation = 15)
Now, you can also convert standard scores and percentiles into age and grade equivalents. Many parents prefer this since it’s easier to understand (e.g. Anna is 2 years behind in reading), but it’s not as precise. In a future article, I’ll discuss these measurements in more detail.
Hopefully you are now able to look at a report and know when your child is below average and by how much. This should help you decide when you want to speak out in meetings. In future installments we’ll discuss the difference between composite and subtest scores. But for now, just know that tests are made up of subtests which often have a Mean of 10. You can use my Cheat Sheet for converting these to percentiles as well. Understanding the differences will be necessary when, for instance, a child’s reading comprehension is average but his reading fluency is below average. We’ll also look into how best to use standardized tests to show progress (or lack thereof). But for now, Good luck at your upcoming Annual Review!
As always, please contact me if you have any questions.